Lib4RI in figures

Lib4RI is not only interesting in terms of resources and services, but also regarding numbers and developments! Below you can find the library's key figures and most important developments visualised as graphs.

2011-2021 in figures

Image
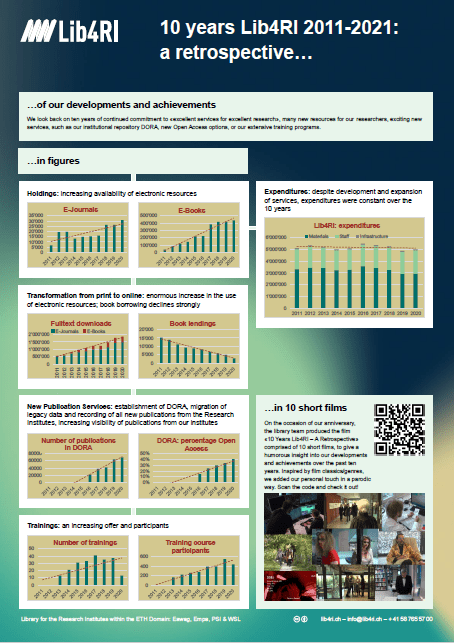
10 years in figures poster

We took the 10th anniversary of the library as an opportunity to summarize the developments and accomplishments within these ten years in figures.

Download the full PDF

Scientists (FTE)

1'429

PhDs (FTE)

546

Library Employees (People)

22

Holdings (Print)

252,056

Holdings (E-journals)

39,071

Holdings (E-books)

945,511

Loans (Print)

1,630

Unique Item Requests (E-journals)

1,025,323

Unique Item Requests (E-books)

39,343

Publications in DORA*

82,331

Full text downloads in DORA*

1,389,510

Document Deliveries

1,197

Participants in Trainings

422

Expenditure (Total in CHF)

5,485,586

Expenditure (Material in CHF)

3,189,431

Data as of 31.12.2022

*More data on DORA are given here.